
Abstract
Two-component epoxy systems have a proven track record for providing excellent mechanical properties, chemical resistance, and adhesion to a wide range of substrates. They are frequently chosen over other technologies especially when chemical resistance is an important attribute.
Chemical resistance is required in a variety of applications from construction and infrastructure to marine and protective metal coatings, and involves many different substrate surfaces in flooring, bridges, wastewater treatment plants, power plants, metal equipment, and marine ships. These assets are constantly under attack from various chemicals such as salt water, acids, and organic solvents. Chemical resistance is critical in providing protection to maximize the service life of these assets.
Dive Deeper: Sign Up To Be An Industry Insider
A number of factors determine the type of epoxy system required for chemical resistance. Key aspects influencing the chemical resistance of an epoxy system include chemical structures, crosslinking density, and degree of cure.
Crosslinking density largely depends on the structure and functionality of the epoxy resin and curing agent, while system mobility impacts the degree of cure. Molecular modeling and analytical techniques such as differential scanning calorimetry, Raman spectroscopy, and dynamic mechanical analysis shed light on the fundamental understanding of the influence of crosslinking density and degree of cure on chemical resistance. This paper details the results of such a fundamental study.
Background
Epoxy systems are well-known for excellent mechanical property, chemical resistance, and adhesion to substrates. They are often used to provide an impermeable barrier, to improve aesthetics, and to enhance chemical resistance to various substrates. Epoxy systems are frequently chosen over other technologies especially when chemical resistance is a critical requirement. Chemical resistance is required in many applications and on various substrates, from construction and infrastructure to marine and protective metal coatings, from concrete, wood, and plastic to metal surfaces. Examples of substrate surfaces requiring chemical resistance include flooring,1 bridges,2 secondary containment,3 pulp and paper facilities,4 wastewater treatment plants, power plants, metal equipment,5 and marine ships. These assets are constantly under attack from different chemicals. Depending on application and substrate, the requirements for chemical resistance can vary substantially, such as classes of chemicals to which resistance is required, and degree and duration of resistance. Choosing the right epoxy system for the application is important to maximize the protection and service life of infrastructure or equipment. Understanding the factors influencing chemical resistance is critical for making the right selection.
Two-component epoxy systems are thermoset polymers consisting of crosslinked network, and the properties of these systems will depend on the curing agent, resin, diluent, and additives chosen. These properties ultimately determine the resistance to the specific chemicals. Besides good chemical resistance, other properties are also important to consider, such as uncompromised adhesion to substrate, expansion and contraction with the substrate, and non-contaminating and resistance to the stored product when used as a lining for a container.
Epoxy coating systems provide protection of the underlying substrates from chemical attack by forming a barrier layer between the substrate and the environment. However, in practice, all polymeric coatings are somewhat permeable to chemical species in the surrounding areas. To achieve the maximum chemical resistance a polymer coating can offer, the components of the system need to be carefully selected to obtain the highest benefit. It is critical to understand the process of chemical attacks to coatings and the key factors contributing to such processes and the degradation of the coatings.
Chemical attack of a thermoset coating can be divided into three processes: swelling of the polymer network, chemical diffusion into the network, and chemical reaction and degradation of the network. Typically, the swelling and diffusion processes take place first, and chemical reaction follows. The chemistry and network structures are key aspects influencing the resistance of a coating system to specific chemical attack. A tight network will have better resistance to swelling and diffusion of chemicals compared to a more open network, thus will provide better chemical resistance. A tighter polymer network corresponds to a higher degree of crosslinking. Resin and curing agent form the mainframe of the epoxy network, and their chemical structure is ultimately the most important factor impacting the crosslinking density. This paper details the significant role crosslinking density plays in chemical resistance, and the elements influencing the crosslinking.
Results and Discussion
Crosslinking Density of Thermoset Coatings
Calculation from modeling and experimental measurement
To understand how crosslinking density impacts the chemical resistance of epoxy coatings, we not only examined the theoretical methodologies to calculate crosslinking density , but also utilized analytical techniques to measure crosslinking density experimentally to validate the calculations.
The calculated numbers were compared with experimental measurements. Crosslinking density in polymers has long been studied6 and a considerable amount of theoretical work has been carried out in calculating and predicting crosslinking density in polymer networks. Early work based on a statistical mechanics approach was extended by J. Scanlan,7 and by D.R. Miller and C.W. Macosko to include probability theory of prepolymer and prepolymer chains of varied degrees of functionality.8 It was developed further to be applicable to thermoset coatings.9 The progress of these works was summarized nicely in a recent publication, and the calculations were reformatted into a more intuitive process based on prepolymer constants that are familiar to coating technologists.10
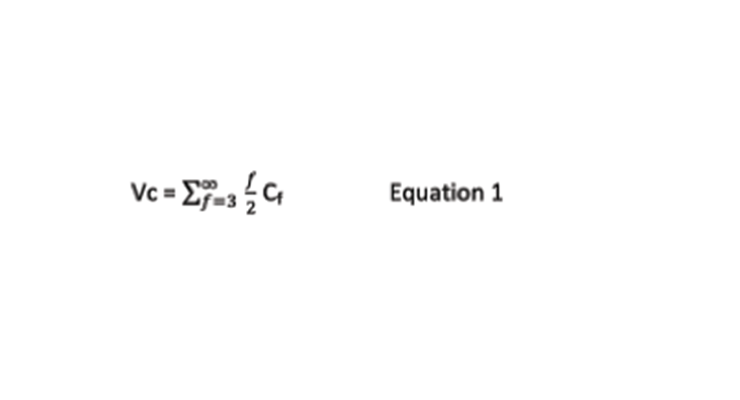
The Scanlan equation is based on ideal networks, and on assumption of complete conversion and equal reactivity of functional groups. A simplified equation is shown below.
The number of crosslinks per unit weight based on readily known constants is expressed as Vc. It is defined as moles of elastically effective network chains per cm3 of sample. The number average molecular weight between crosslinking points is Mc, and it is the weight of network containing one mole of elastically effective chains. Mc can be easily calculated from the concentration of reactive functional groups Cf.
Mc = density/ Vc
Cf = concentration of reactive functional groups in moles/cm3
f = functionality
The Macosko-Miller model uses basic laws of probability and the recursive nature of the crosslinking process to calculate average network properties, and can be used on non-stoichiometric systems, and incomplete conversions. D. R. Bauer presented two simple programs to calculate both pre-gel and post-gel network structure properties in thermoset coatings.11 Below the gel point, average weight molecular weight (Mw) is calculated as a function of percent reaction, and above gel point, the crosslinking density is calculated as concentration of effective strands in mole/g, which is similar to Vc in the Scanlan equation.
Experimentally, crosslinking density can be measured as molecular weight between crosslinks, Mc, by dynamic mechanical analysis (DMA) using the equation below when the instrument is run in shear mode, where R is the universal gas constant, T is absolute temperature, and E’ is the storage modulus in the rubbery region. For fully cured thermosets, the E’ data at Tg + 40 ºC are often used to calculate Mc.12
Formulations demonstrate the Influence of crosslinking density on chemical resistance
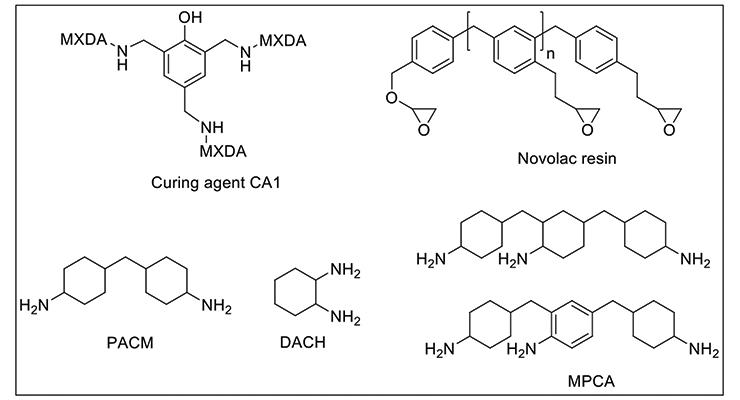
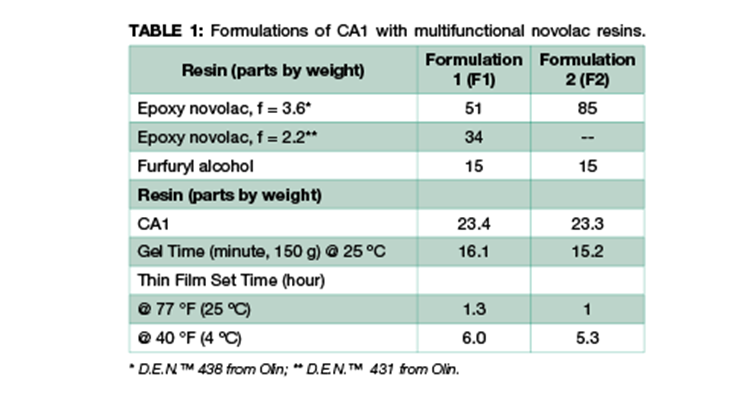
We have investigated two systems using the same m-xylenediamine (MXDA) Mannich base curing agent, CA113 with two formulations of novolac epoxy resin to achieve maximum chemical resistance against very aggressive chemicals such as methylene chloride, 30% nitric acid, and phenol. The chemical structures of the representative component of CA1 and the resins used in the formulations are shown in Figure 1. Curing agent CA1 and novolac resins are chosen for their high functionality to provide higher crosslinking density and better chemical resistance. The formulations are illustrated in Table 1. Due to the high viscosity of novolac resins, 15 wt% of furfuryl alcohol was added as plasticizer to reduce viscosity and increase system mobility during cure. Formulation 2 has a higher content of higher functionality novolac resin. Data in Table 1 shows that Formulations 1 and 2 have very similar handling properties in terms of gel time and thin film set time.
Crosslinking density measured by DMA
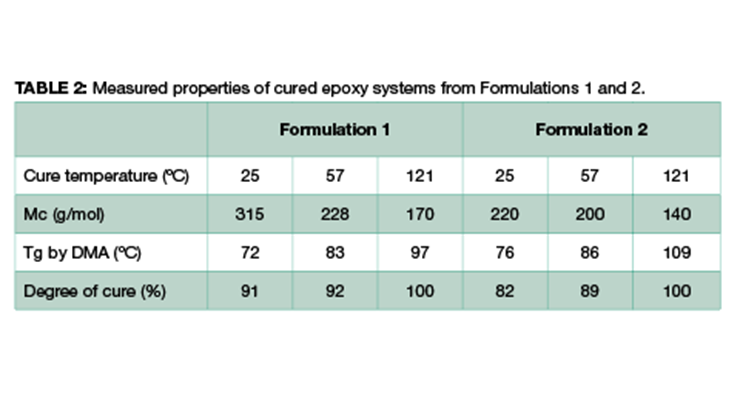
These two systems were each cured under the following three different conditions, and the properties of the cured epoxy were measured. The physical properties include degree of cure using differential scanning calorimetry (DSC) measurement,14 glass transition temperature Tg by DMA analysis, and molecular weight between crosslinking Mc from DMA derived from Equation 2. The results are summarized in Table 2.
1) 7 days at 77 ºF (25 ºC),
2) 3 days at 77 ºF (25 ºC) plus 2 hours at 135 ºF (57 ºC), and
3) 3 days at 77 ºF (25 ºC) plus 2 hours at 250 ºF (121 ºC).
From the results shown in Table 2, higher post-cure temperature has multiple impacts. It increases the degree of cure from 91% and 82% at 25 ºC to 100% for Formulations 1 and 2 respectively, and the higher degree of cure leads to higher glass transition temperature (Tg) and higher crosslinking density as expressed by lower Mc. Comparing Formulations 1 and 2 cured under the same condition, Formulation 2 shows a higher glass transition temperature and higher degree of crosslinking with lower Mc. This is consistent with the composition of the formulations, where Formulation 2 has a higher content of high-functionality resin which translates directly to higher crosslinking density.
Crosslinking density calculated by modeling methods
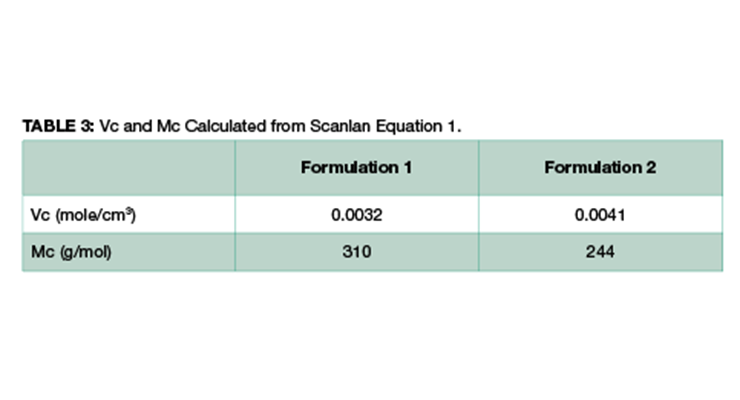
Theoretically, crosslinking density can be calculated using Equation 1. Assuming the density of the final fully-cured epoxy is 1 g/cm3, Vc and Mc of Formulations 1 and 2 can be easily calculated, and the data are shown in Table 3. The calculated Mc value is consistent with Mc measured by DMA, and Formulation 2 has lower Mc and higher crosslinking density.
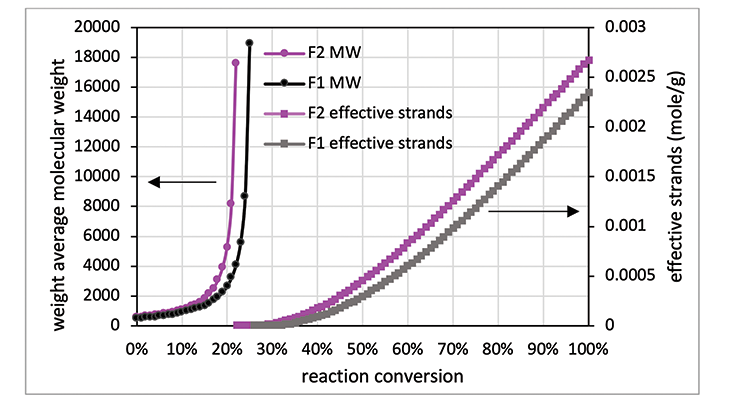
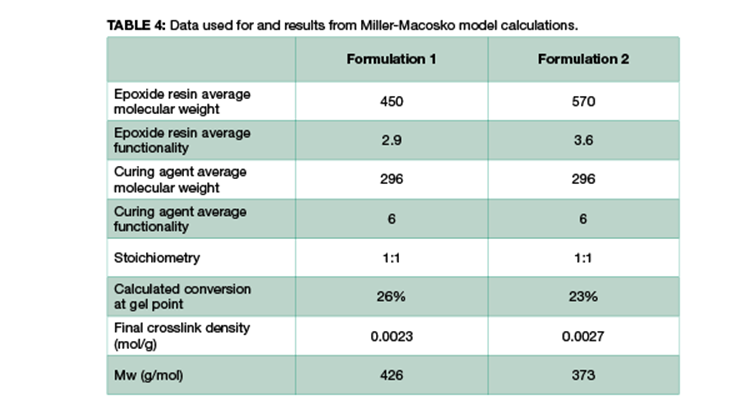
As mentioned above, another method to calculate crosslinking density is to follow Miller-Macosko modeling. The data required for the calculations is summarized in Table 4, together with the calculated gel point and crosslink density expressed in moles per gram. Figure 2 is a graphical representation of the weight average molecular weight (Mw) and the concentrations of effective strands as a function of percent conversion. The latter can be interpreted as a mathematical expression of the crosslink density Mw.
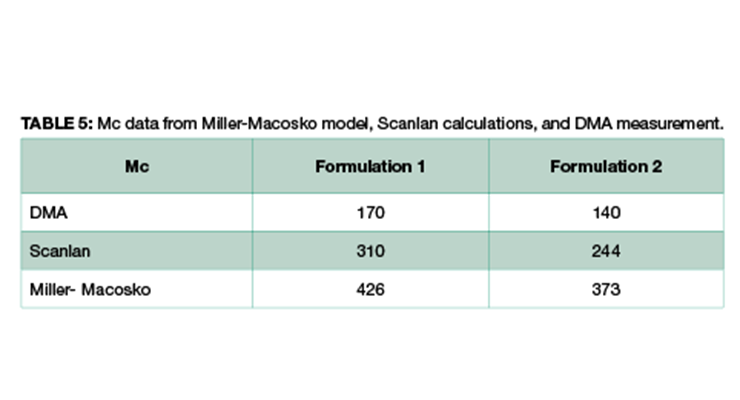
As shown in Table 4 and Figure 2, Formulation 2 has a faster rate of molecular weight build-up, and reaches gel point faster than Formulation 1, 26% versus 23%. It also has lower Mc at any conversion than Formulation 1. The data is in line with Mc from DMA measurement, and from calculation based on the Scanlan equation. The Mc data from calculation and DMA measurement is tabulated in Table 5 for comparison. Although the absolute numbers of these three methods are not exactly identical, the trend is the same for all three, showing Formulation 1 has higher Mc and lower crosslinking density at full cure. Numbers from Miller-Macosko are the highest, which can be attributed in part to its weight average molecular weight instead of number average by the other two methods. The data suggest Scanlan and Miller-Macosko modeling can be used to calculate and predict crosslinking density of thermoset coatings.
Chemical Resistance
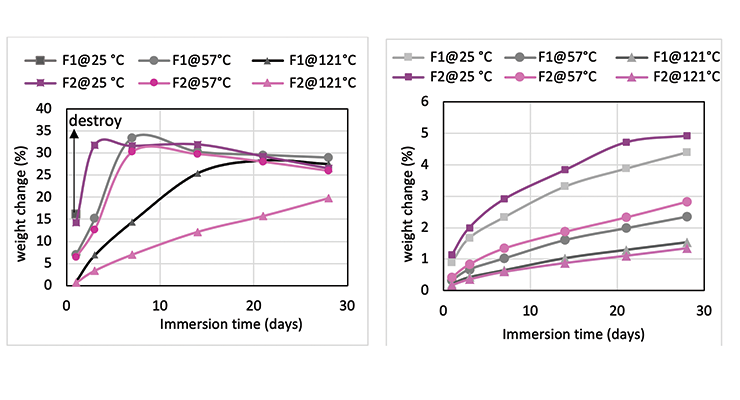
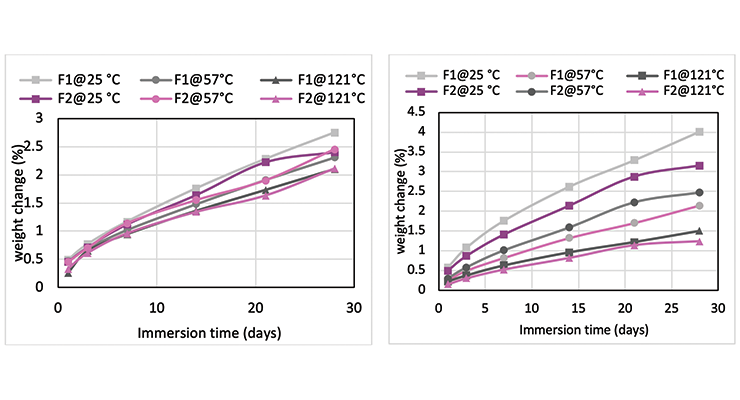
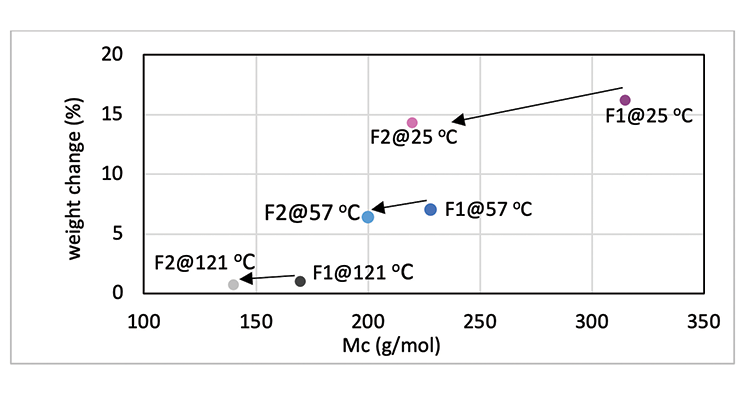
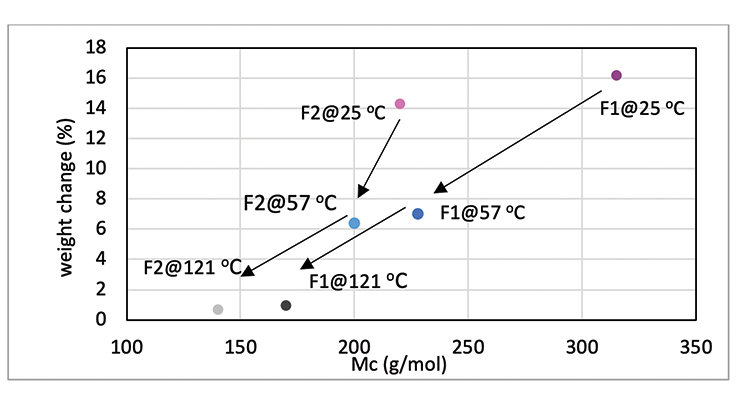
Mc data from modeling calculations and DMA analysis have shown that Formulation 2 has higher crosslinking density than Formulation 1. The next step was to investigate its influence on chemical resistance. Chemical resistance testing was carried out by immersion studies. Samples of 1” x 3” x 1/8” were immersed in four very aggressive reagents: methylene chloride, 30% nitric acid, 10% acetic acid and 10% phenol. The tests were done in triplicate per sample. Weight change was monitored over time to determine chemical resistance. Organic polymer thermoset typically swells to some degree when immersed in chemicals and the swelling is often manifested as weight gain. The more the weight gain, the more swelling. Figures 3 through 6 show the impact of the cure schedule on chemical resistance. In all cases, higher post-cure temperature results in higher degree of crosslinking and, therefore, less weight gain. Also an increase in functionality from Formulation 1 to Formulation 2 provides higher crosslinking density and, therefore, less weight gain. This is illustrated clearly in Figures 7 and 8 as a function of crosslinking density.
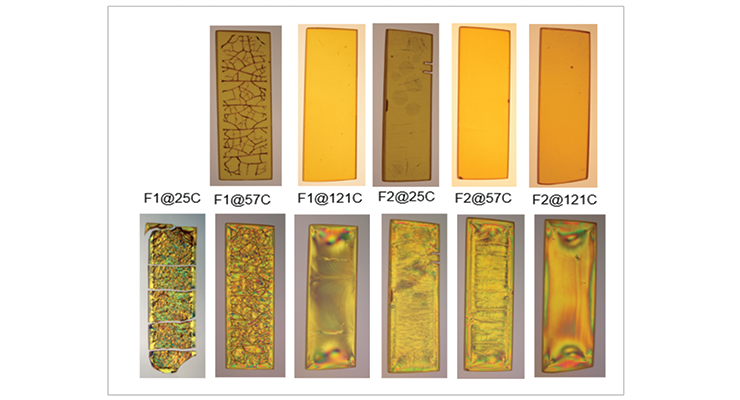
The photographs of the samples under normal light and polarized light after 1-day methylene chloride immersion are shown in Figure 9. Polarized light highlights the stress concentration of the samples. The effect of post-cure temperature and crosslinking density on the resistance to methylene chloride can be seen clearly. Formulation 1 cured at ambient temperature without post cure was destroyed after 3 day, while the 57 ºC post-cured sample shows evidence of cracking after 7 days, but remained intact as one piece after 28-day test. The 121 ºC post-cured sample show no evidence of cracking for the 28-day duration of the test. All 3 samples for Formulation 2 stayed intact after 28 days immersion.
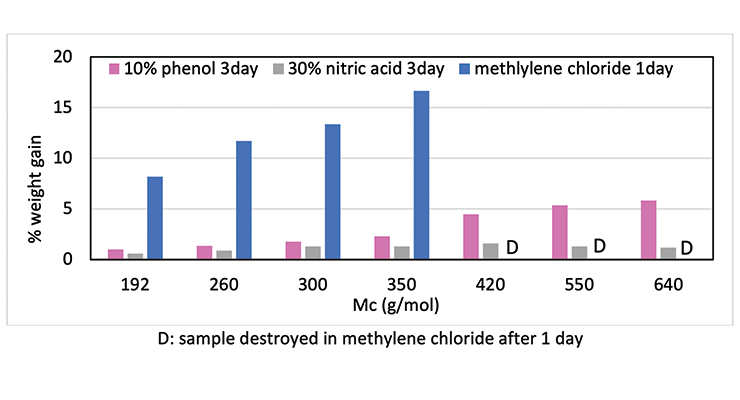
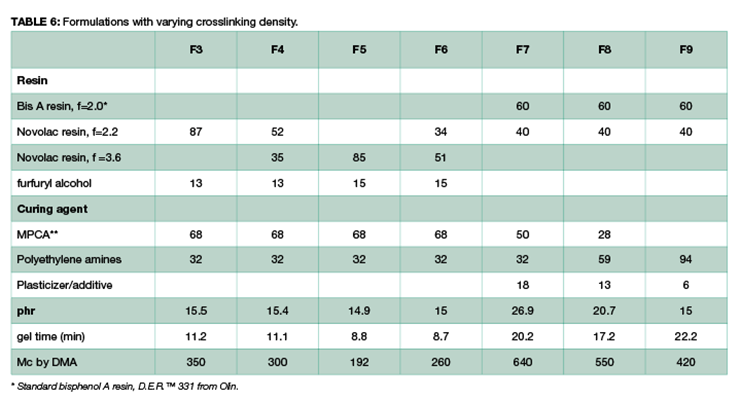
To demonstrate that the effect of crosslinking density on chemical resistance can be applied to other systems, several formulations with varying degrees of crosslinking density were evaluated. The formulations are shown in Table 6. Methylene bridge poly(cycloaliphatic-aromatic)amines (MPCA), structure shown in Figure 1, was chosen as the base amine due to its known property for high chemical resistance, and was formulated with polyethylene amines to increase crosslinking density.
Chemical resistance tests were carried out in 3 aggressive chemicals: 10% phenol, methylene chloride, and 30% nitric acid. Figure 10 shows the chemical resistance data as a function of crosslinking density: the higher the crosslinking density, the less weight gain, and the better chemical resistance. For Mc above 420, methylene chloride resistance is rather poor, and samples were destroyed within one day. Similarly, phenol and nitric acid resistance also decreases with increase of Mc at lower crosslinking density.
Influence of chemical structures on chemical resistance
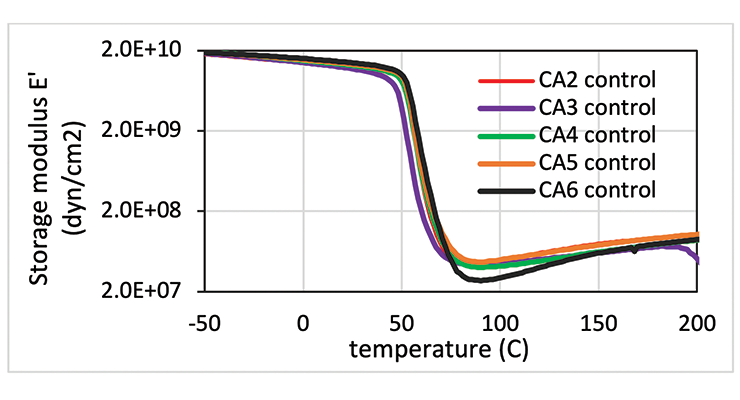
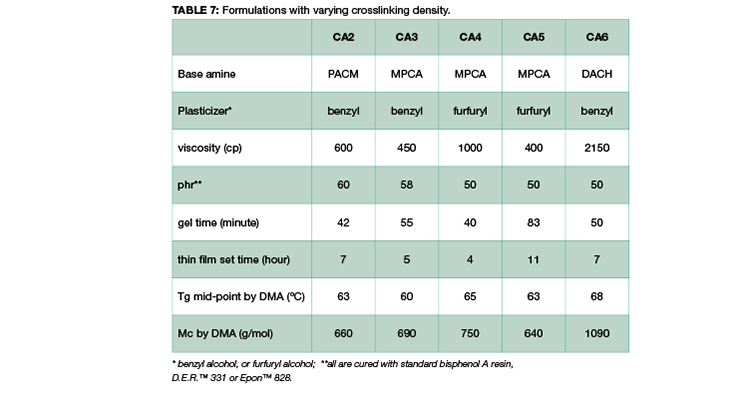
Other key factors influencing the chemical resistance were also investigated to shed light on structure-property correlation. Table 7 shows curing agents, formulations and basic handling properties used in this study, and the chemical structures are shown in Figure 1. All the curing agents are based on cycloaliphatic amines due to their good chemical resistance to mineral acids, solvents, and organic acids. CA2 is based on di(4-aminocyclohexyl)methane (PACM); CA3, CA4, and CA5, are based on MPCA; and CA6 is based on 1,2-diaminocyclohexane (DACH), a very small amine with two amine functional groups close to each other; specifically CA5 is also an amidoamine that can be used in high chemical resistance tile grout application which requires water cleanability. All curing agents are formulated with either benzyl alcohol or furfuryl alcohol as plasticizer.
From the data shown in Table 7, all the curing agents have similar glass transition temperatures measured by DMA after 7 days cure at 23 ºC. The crosslinking density measured by Mc is also very similar, except for CA6, which is based on the smallest amine, DACH. The DMA curves are compared in Figure 11. The curves in Figure 11 show that all the curing agent have a similar Tg and modulus except CA6. CA6 has the lowest storage modulus and the highest Mc.
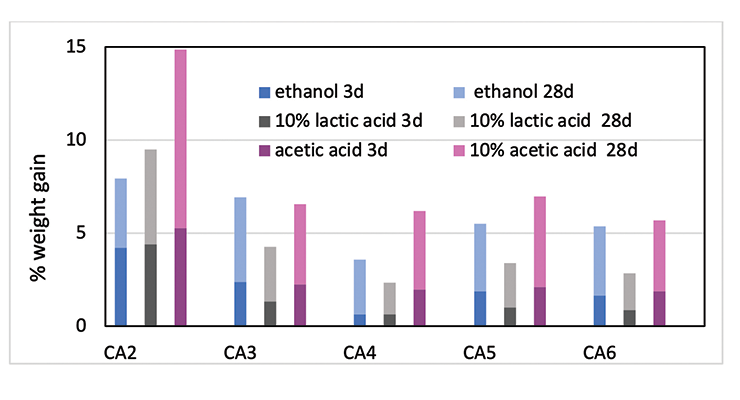
The chemical resistance to specific chemicals, such as ethanol, diluted acetic acid and lactic acid, are compared and shown in Figure 12. Figure 12 shows the weight gain comparison of the curing agents at 3 days and 28 days immersion. Overall, PACM based curing agent CA2 has the poorest performance, and CA4 based on MPCA the best performance in the three chemicals tested. MPCA and DACH based curing agents perform better than PACM based CA2. This could be explained by the chemical structure difference. MPCA has more functional group per molecule than PACM, and therefore forms tighter network. In the case of DACH in CA6, the two amine groups are close to each other which is also likely to form very tight network when reacting with epoxy. The close proximity poses steric hindrance and possibly slows down reaction, resulting in higher Mc. Nevertheless, the high Mc is compensated by tighter network, which balances out the downside of higher Mc, and still provides good chemical resistance in CA6. Mc is a good indicator and provides very good prediction when comparing the same amine curing agent. If different curing agents are involved, other parameters such as chemical structure or conformation and additive like plasticizer also play important role in chemical resistance For example, the main difference between CA3 and CA4 is the plasticizer. This set of data also shows choosing the right plasticizer is important to achieve required chemical resistance.
Hot Oleic Acid Resistance
Chemical resistance is not limited to ambient temperature exposure only. Many applications require chemical resistance at elevated temperature. For instance, in food processing facilities and commercial kitchens, chemical resistance to hot oil is required when surface areas such as floors or other surfaces are often exposed to hot cooking oil or grease. Oleic acid was used as a model chemical for investigation of the chemical resistance to hot oil. Cured epoxy samples were immersed in 80 oC hot oleic acid and the weight change was monitored. The immersed samples were analyzed by DMA, Raman and IR to detect the difference before and after immersion. The oleic acid used for immersion was analyzed by IR to detect any plasticizer loss to oleic acid.
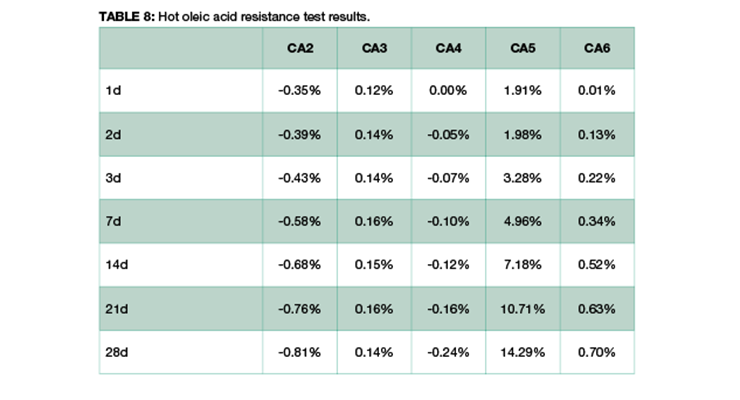
Table 8 shows the weight change of samples over time. Formulations of CA2 and CA4 have very small weight loss over a period of 28 days, probably due to the loss of plasticizer, while CA3 has minimum weight gain, and CA6 has small weight gain. CA5, a formulated amidoamine, has the highest weight gain. This could be explained by the presence of similar long alkyl chain in the curing agent and in oleic acid, and they share affinity to each other. Thus, the network is swelling and adsorbing hot oleic acid during immersion.
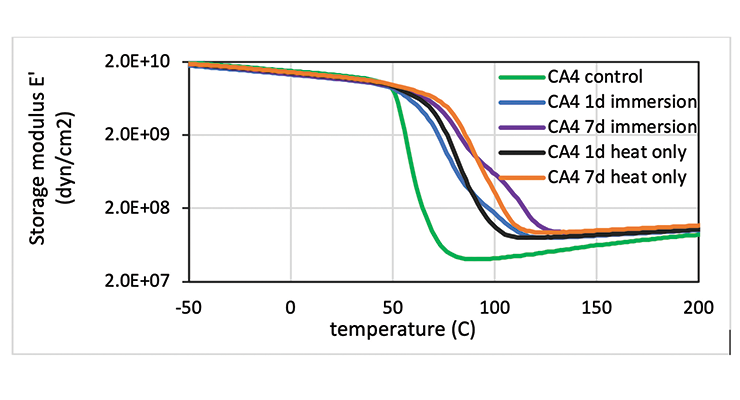
The effect of chemical immersion on the physical properties of the cured epoxy network was investigated by DMA. To delineate the effect of a hot temperature of 80 ºC from chemical exposure to oleic acid, samples exposed only to heat were analyzed for comparison, and samples cured at 23 ºC before immersion were used as a control. Table 9 lists the Mc and Tg of the samples. The control sample has the lowest Tg and highest Mc, and the 7-day samples either immersed in hot oleic acid or heat treated only show higher than the 1-day samples. The data suggest the high temperature treatment promoted more cure in the samples leading to higher crosslinking density. This can be clearly visualized in Figure 13 which shows the DMA plot as a function of temperature for CA4. The control shows the lowest storage modulus E’, and E’ increases with temperature clearly suggesting additional cure in the rheometer. The heat treated only and hot oleic acid immersed samples all have relatively flat E’ indicating the samples were fully cured. The 7-day samples show higher E’ than 1-day samples, pointing to a higher degree of reaction. It is interesting to note that hot oleic acid immersed samples show a second peak in E’ at higher temperature, resulting in a second Tg while the heat treated only sample does not have this peak. The presence of oleic acid contributes to the higher second Tg. Other curing agents have very similar behaviour to CA4.
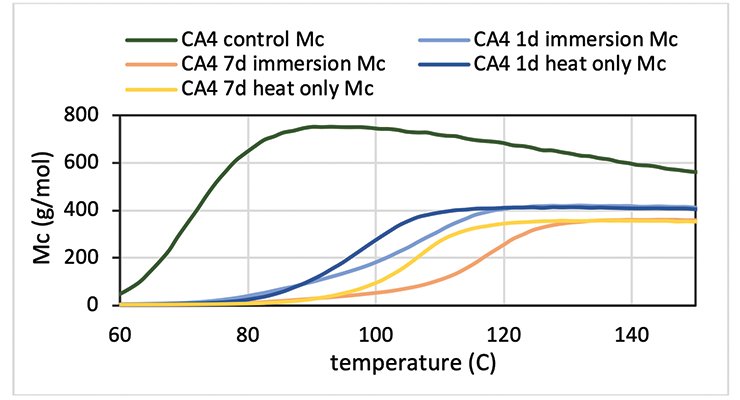
The E’ data above indicates the control sample experienced additional cure in the rheometer. This can be clearly illustrated from the Mc versus temperature plot in Figure 14 for CA4. For immersion and heat treated samples, Mc remains flat in the rubbery region while Mc decreases with temperature for the control sample. Longer immersion or heat treatment slightly reduces Mc further. DMA data also show that immersed samples reach maximum Mc at higher temperature than the heat only sample, although exposure to hot oleic acid for 7 days does not seem to negatively impact the physical property of the samples such as modulus shown in Figure 13. Optical pictures of the samples don’t show much visual change; in some cases, just a darker color.
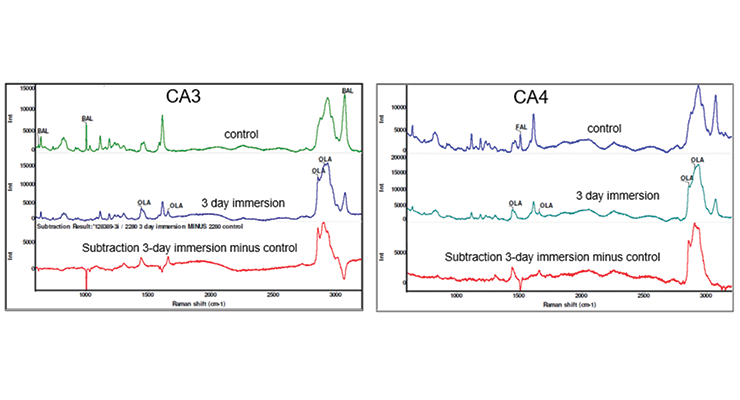
More detailed investigation of the samples immersed in hot oleic acid was carried out by Raman and Infrared spectroscopy. Raman spectra of the samples was obtained with the laser focused at 10 microns below the surface using a 532 nm laser. Raman spectra of control CA3 sample not exposed to hot oleic acid, and sample immersed in hot oleic acid for 3 days are shown in Figure 15, top and middle. The bottom spectrum in Figure 15 is the subtraction result of immersed sample from control sample. The control sample has bands characteristic of benzyl alcohol marked at 621, 1003, and 3059 Rcm-1, while the 3-day immersion sample no longer shows the characteristic benzyl alcohol bands but does show characteristic oleic acid bands marked at 1441, 1654, 2854, and 2900 Rcm-1. The result of subtracting the spectrum shows the addition of oleic acid with positive features and the loss of benzyl alcohol with negative features. Similarly, Raman spectra of CA4 show the addition of oleic acid with positive features and the loss of the characteristic furfuryl alcohol band marked at 1505 Rcm-1 with negative features, and the addition of oleic acid with positive features in Figure 15.
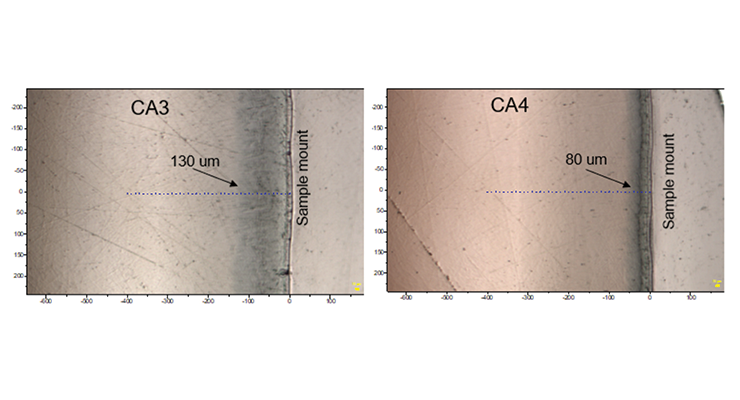
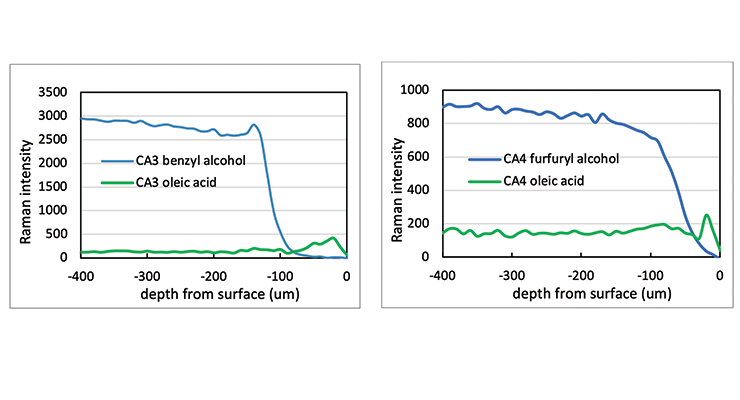
Cross-section images and Raman line maps were captured to provide detailed information on what happened at the surface of the samples. The images and line maps were acquired starting at the outside surface of the cross-section of the sample and proceeding inward with 10 micron steps using a confocal microscope system with a 785 nm laser. Images of the polished cross-section from the 3-day immersion sample of CA3 and CA4 near the surface are shown in Figure 16. The sampling points for a Raman line map are indicated by blue + symbols. There is a darker layer under the surface where it was exposed to hot oleic acid, and the depth is about 130 um and 80 um for CA3 and CA4 respectively.
The Raman line maps showing the intensity of the 1003 Rcm-1 benzyl alcohol band or 1505 Rcm-1 furfuryl alcohol band and 1441 Rcm-1 oleic acid band as a function of depth from the sample surface are demonstrated in Figure 17 for CA3 and CA4. The Raman line maps show the benzyl alcohol was not detected until 130 microns from the surface for CA3 and furfuryl alcohol was not detected until 80 microns from the surface for CA4. When Raman intensity of benzyl alcohol or furfuryl alcohol decreases, the intensity of oleic acid is picking up, indicating the plasticizer was replaced by oleic acid. The same test was carried out for CA5 and CA6 and the Raman line maps show the furfuryl alcohol and benzyl alcohol is not detected until 200 and 80 microns from the surface, respectively.
The Raman line maps data clearly show the effect of plasticizer and chemical structures on the chemical resistance of hot oleic acid. The difference between CA3 and CA4 is the plasticizer. Furfuryl alcohol in CA4 prevented oleic acid from penetrating deeper into samples. While CA3 and CA6 have the same plasticizer but different cycloaliphatic amine, DACH in CA6 provide better protection than CA3. Hot oleic acid was detected deepest in CA5 compared to other curing agents. This is likely due to the similarly between the presence of long chain in amidoamine in the curing agent and oleic acid. The finding is consistent with the weight change data shown above.
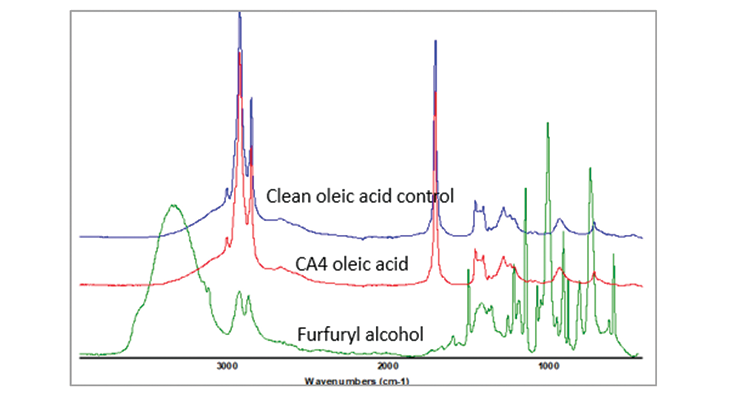
Raman data shows that small amount of the plasticizer was replaced by oleic acid during immersion test. To confirm this finding, Infrared spectroscopy was used to analyze the oleic acid from the immersion test, and compared that with clean oleic acid and benzyl alcohol or furfuryl alcohol spectra and the spectra are shown on the same scale in Figure 18. The spectra of the oleic acid immersion sample did not show outstanding differences from the clean oleic acid, especially in the strongest infrared band for furfuryl alcohol at 1011cm-1. The amount of furfuryl alcohol replaced by oleic acid and diffused out of sample was only trace amount, and not detected by infrared spectrum. Raman spectroscopy is a more sensitive technique to detect the minor changes.
Experimental
All epoxy resin and curing agents were obtained from commercial sources and cured at 1:1 amine/epoxy stoichiometry. Viscosity was measured using a Brookfield single cylinder rotational type viscometer, and gel time was obtained with a TECHNE gelation timer model FGT 6 in accordance with ASTM D2471. Samples for chemical resistance tests were cured at 25 ºC and 50% relative humidity for 7 days. An 8” x 8” x 1/8” plaque was prepared and cut into 1” x 3” x 1/8” size samples. . The initial weight was obtained before immersion test in designated chemicals, at specified temperature and time duration. At end of each time duration, the sample was taken out of test chemicals, allowed to equilibrate to ambient temperature for one hour, and the weight of the samples were measured.
The degree of cure for each formulation was determined by DSC using a TA Instruments Q2000 DSC calibrated in T4P mode at a heating rate of 10°C/minute with Indium. About 5~10 mg was heated from -50 ºC to 250 ºC, cooled back to -50 ºC and the test was repeated. The degree of cure was determined by subtracting the residual heat of cure after 7 days from the initial total heat of cure, divided by the initial total heat of cure.
Raman spectra of the samples with the laser focused at 10 microns below the surface were obtained using a Horiba LabRAM HR Raman confocal microscope system and 532 nm laser. The cured epoxy samples were cut, mounted, and polished to a 0.05 micron finish to produce cross-sections suitable for Raman mapping. Raman line maps starting at the outside surface of each sample cross-section and proceeding inward with 10-micron steps were obtained using a Horiba LabRAM HR Raman confocal microscope system. The 785 nm laser was used to avoid the necessity of photobleaching the samples.
Infrared spectra of liquid samples were acquired by depositing a drop of liquid sample onto a diamond crystal in a SmartORBIT™ ATR accessory and a spectrum was obtained by co-adding 128 scans at 4 cm-1 resolution with a Nicolet Nexus 670 FT-IR interferometer. Each spectrum was corrected for optical dispersion and variation in effective optical path length using the Thermo/Nicolet Advanced ATR Correction function.
Dynamic mechanical analysis (DMA) was performed using TA Instruments RSA G2 rheometer and data were collected in shear over the -60 to 250 ºC range using a 3 ºC/min ramp and a 1 Hz deformation frequency. Measurements were made in a dry nitrogen environment. The dynamic moduli were estimated to be accurate to within ± 10%. Samples were cured at 23 ºC and 50% RH for 7 days before testing, unless specified otherwise. Storage modulus, glass transition temperature and molecular weight between crosslinking points Mc were acquired from DMA analysis.
Conclusions
Chemical resistance is critical for thermoset epoxy coatings to provide long lasting protection to the substrates underneath. One of the key factors influencing chemical resistance is crosslinking density. Crosslinking density of a thermoset epoxy system can be calculated and predicted by Scanlan probability theory and Miller-Makosco model and measured by experimental method using dynamic mechanical analysis (DMA). The experimental values are consistent with calculated numbers. From model systems using the same curing agent, crosslinking density increases with higher cure temperature and higher resin functionality, and the increased crosslinking density results in improved chemical resistance in general. Other aspects important for better chemical resistance are related to chemical structure of the curing agents, plasticizer and additives.
Analytical technique such as Raman spectroscopy has been demonstrated to be a very useful tool to aid understanding of the change at microlevel when a cured epoxy sample is exposed to a chemical. For a hot oleic acid resistance test, Raman spectra and line maps show the loss of plasticizer and the diffusion of the oleic acid into the sub-surface of the samples. The chemical structure of the curing agents and type of the plasticizer play an important role in this diffusion process. However after 7-day exposure to hot oleic acid, this diffusion process does not seem to have an impact on physical property of the samples based on DMA analysis. The combination of oleic acid and hot temperature on the contrary increase the crosslinking density of the samples upon exposure, which leads to higher glass transition temperature and higher modulus.
References
1. Boova A. A. J. Protective Coatings & Linings, 1990, 36-44.
2. Clear, K. C, Hartt, W. H.; McIntyre, J.;Lee, S. K. “Performance of epoxy-coated reinforcing steel in highway bridges” in National Cooperative Highway Research Program, Report 370”, 1997.
3. Hazen, F. J. Protective Coatings & Linings, 1993, 58-67.
4. Neville, F.; and Wolf E. J. J. Protective Coatings & Linings, 1991, 44-48.
5. Nikravesh, B.; Ramezanzadeh, B.; Sarabi, A. A.; Kasiriha, S. M. Corrosion Science, 2011, 53 (4),1592-1603.
6. Flory, P.J. Chem. Revs., 1944, 35 (51), 51-75.
7. Scanlan, J. J. Polymer Sci., 1960, 43, 501-508.
8. (a) Miller, D.R.; Macosko, C.W. Macromolecules, 1976, 9 (2), 206-211. (b) Miller, D. R., Valles, E.M. and Macosko, C.W. Polym. Eng. Sci., 1979, 19 (4), 272.
9. Hill, L.W. Prog. Org. Coatings, 1997, 31, 235-243.
10. Campbell, D. Paint & Coatings Industry, July 3, 2018.
11. Baurer, D. R. J. Coatings Tech. 1988, 88 (758), 53.
12. Vratsanos, M. Coatings Tech July 2017, 28-38
13. Ancamine® 2422 technical datasheet.
14. (a) Lee, W. I., Loos, A. C., Springer, G. S. J. Composite Mat. 1982, 16, 510. (b) Dangayach, K., Smith, C. Journal of Coatings Technology, 1996, 68 (863), 29-37.
Contact information:
shiying.zheng@evonik.com
610-573-5261
