Doug Bohn, Orr and Boss01.08.18
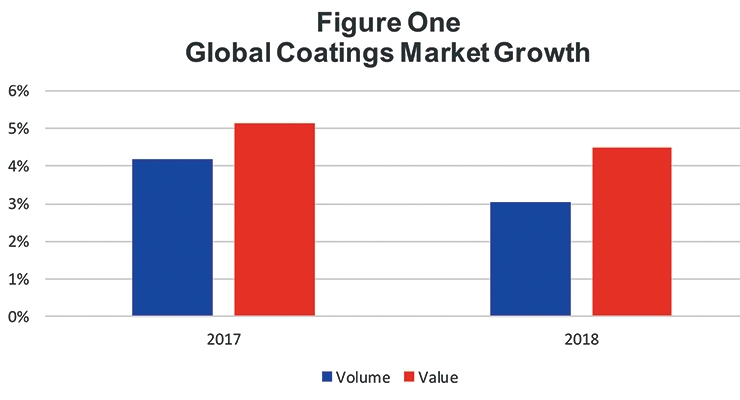
The global coatings industry experienced good growth in 2017 with decorative coatings leading the way in terms of global growth. Automotive and industrial coatings also experienced good growth too but not quite as high as that of decorative coatings segment. In general, we expect growth to continue in 2018; although at a slightly slower pace than in 2017.
Coatings Market Growth Rates
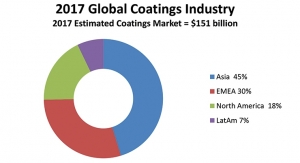
The global coatings market grew at an estimated rate of 4.2% in volume terms and 5.0% in value terms from 2016. We are predicting the growth in 2018 to be solid again although not quite as high as that in 2017 with a 3% volume growth and 4.4% value growth. The 2017 growth values were slightly higher than global GDP growth of 3.7%. The main driver of the slightly faster than GDP growth rates is that construction activity growth is higher than GDP growth in many regions of the world. Also, Asia comprises 45% of the value of the global coatings market. Since it continues to grow faster than the other geographies, it lifts overall coatings growth. Finally, price inflation (driven by raw material price increases) is having some impact on the value growth numbers. One important item to note is that the value growth figures are based on U.S. Dollars. If we base them on another currency, the figures would be different. For instance, if we base the value figures on Euros, the 2017 global value growth is 3.5% instead of 5.2%. This is because the Euro appreciated in value throughout 2017 versus the U.S. dollar. To keep things consistent, we will use U.S. Dollars.
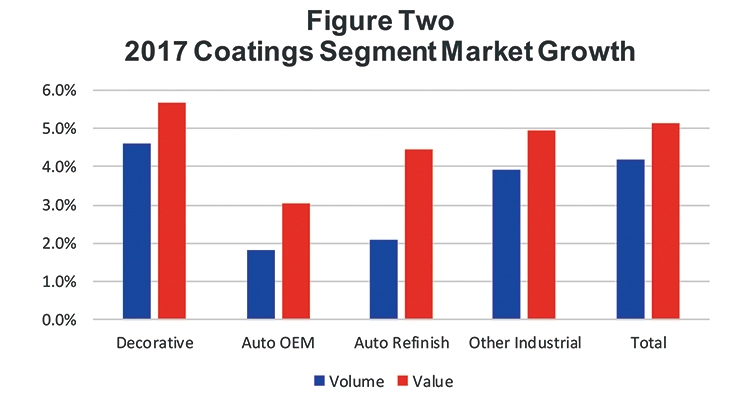
One of the main drivers of the global coatings growth rate is decorative coatings. As Figure Two indicates, the global growth rate in 2017 for decorative coatings was the highest of the major segments. This is primarily driven by high construction activity. For example, construction activity in Europe grew by 3.5% in 2017. In China, construction activity grew by 10% in 2017. This was much higher than GDP growth in both of these regions; 2017 European Union estimated GDP growth is 2.3% and in China it was 6.7%.
The higher than normal construction activity growth drove the decorative coatings markets to higher growth rates in both Europe and Asia. In North America, the 2017 decorative coatings growth rate is estimated to be 2.5% in volume and 4.4% in value terms. These figures are also higher than the estimated GDP growth of 2.2% in the United States. This all explains the above GDP growth rates for decorative coatings.
Auto OEM coatings are driven by automotive units build. In 2017, the total number of global automotive builds was estimated to have grown 1.7% which resulted in auto OEM coatings growing at about 1.7% in volume terms and 3% in value terms.
Auto refinish is driven by the number of cars on the road, vehicles miles driven and the accident rate. All of these values have grown at a moderate rate in 2017. Other industrial coatings includes all sorts of different coating applications including non-automotive OEM applications, powder coatings, wood, coil, packaging, industrial maintenance, protective coatings and marine. Generally, these markets grow at the rate of growth in industrial production. Industrial production grew at 7.0% in China, 2.0% in Europe, and 1.6% in the United States. These growth rates track the rate of growth in the Other Industrial Coatings markets.
Coatings Markets by Geography
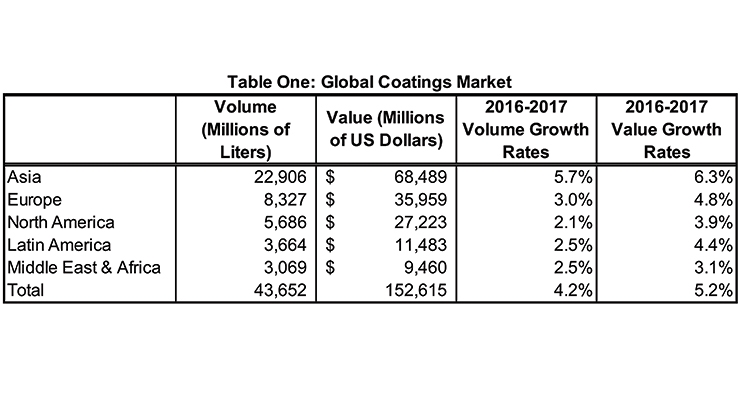
Geographically, Asia is the largest region within the global coatings industry and has been for a number of years. Asia accounts for 52% of the volume and 45% of the value of the global coatings market. Not only is Asia the largest market, but it is also the fastest growing market. In 2017, the Asian coatings industry was estimated to have grown by 5.7% in volume and 6.3% in value. The largest coatings market within Asia is China. China accounts for about 56% of the value of the Asian coatings market. The next largest markets are India and Japan. As discussed in an article in the August issue of Coatings World, India has eclipsed Japan as the second largest coatings market in Asia, although the two are similarly sized.
As the data in Table One indicates, Europe and North America are the second and third largest markets. Europe accounted for 19% of the volume and 23% of the value of the global coatings market and North America accounted for 13% of the volume and 18% of the value of the global coatings market.
2018 Outlook
The key drivers of the global coatings market are GDP, construction activity, automotive and industrial production. If we look at each of these drivers individually, we can discern that the likely 2018 global coatings market growth should be good but slightly lower than that in 2017.
Global GDP is expected to increase slightly from a 2017 estimated value of 3.58% to a forecasted 2018 level of 3.74%. Of the major coatings markets, China’s GDP growth is expected to remain stable in 2018 at 6.7%. India’s GDP growth rate is expected to increase from 5.9% in 2017 to 7.0% in 2018. Thus, the Indian paint and coatings market should continue growth at a fast rate. The European Union’s (EU) GDP growth rate is also expected to remain stable at 2.3% in 2018. GDP in the United States is expected to slightly increase from 2.2% to 2.5%. Thus, overall global GDP is expected to grow slightly faster in 2018 than in 2017 and this provide a slight boost to overall coatings market growth rates.
The construction market is expected to slightly slow globally in 2018. Construction spending in the United States is expected to grow in the 3.5-4.0% range versus in the 4-4.5% range in 2017. Similarly, in the EU the rate of construction activity will slow slightly from a 3.5% growth rate to a 2.5% growth rate. The construction market in China is expected to continue growing at high rates; although not quite as high as we saw in 2017. On a global basis, the construction market will continue to grow in 2018 but it will not be quite as strong as that in 2017.
The automotive market is another key driver of the coatings market. In 2017, global automotive builds were estimated to have grown by 1.7%. Most forecasts going forward are calling for a forecasted increase of 2-3% in the coming years. Like many markets, Asia is expected to lead the increase with growth rates in the 3-4% range. The EU and North America are both expected to see automotive builds increase in the 0-2% range in 2018. We can say that overall, automotive should grow slightly faster in 2018 than it did in 2017.
The final key driver of overall coatings demand is industrial production. Similar to construction, global industrial production growth is expected to be good in 2018, although not quite as strong as in 2017. For example, the estimated 2017 Industrial production growth rate was 7.0%. Most forecasts expect Chinese industrial production to be in the 5.5-6.5% range. In the United States, industrial production is estimated to have grown by 1.6% in 2017 and is expected to grow at a similar rate in 2018. The EU industrial production grew at about 2% in 2017 and is expected to moderate slightly to 1-2% in 2018.
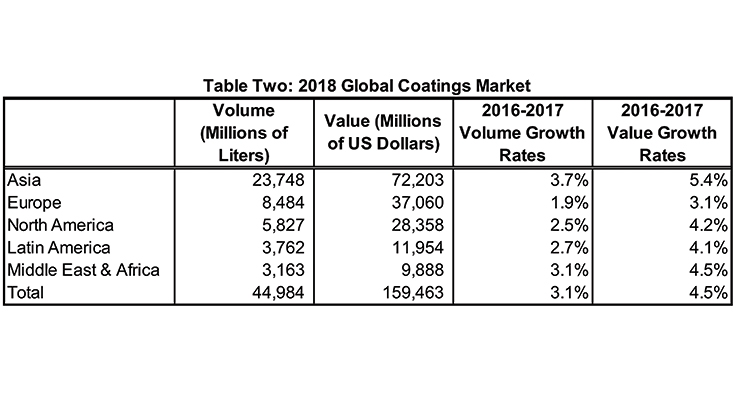
Taken together, the above four drivers indicate good growth in coatings volume in 2018 although the growth rate will be slightly lower than in 2017 due to moderating construction activity and industrial production. Our forecasts for 2018 indicate that the global coatings market should grow at 3.1% in terms of volume and 4.5% in terms of value. Once again, Asia will be the fastest growing region with volume growth of 3.7% and value growth of 5.4%. Table Two summarizes the 2018 forecasts.
Summary
Summarizing, in 2017 the global coatings market experienced a good year but we expect that the growth will moderate slightly in 2018. The overall driver of the good growth rate was high rate of construction activity globally which drove good gains in the decorative and other coatings markets. Automotive and industrial production grew at slower paces globally than construction in 2017. Automotive may increase slightly in 2018 while industrial production growth will moderate slightly in 2018. Of course, the growth and market conditions will vary depending upon the region of the world that you operate in as well as the specific market sub-segments that you are selling into but overall 2018 should look similar to 2017, albeit with slightly lower growth values.

