Fabio Aguirre, Adam Grzesiak, Asjad Shafi and Yohannes Ghirmazion, The Dow Chemical Co.12.03.18
Dow Polyurethanes strives to provide the information customers need to guide the selection of raw materials for their formulations and targeted applications. The information is tailored for formulators that use first principles as well as for those that only need the data required to balance the stoichiometry of their systems.
To improve our customer’s experience we have developed searching and modeling tools that would allow formulators not only to quickly find the components they need but also to predict the viscosity of basic prepolymers and quasi-prepolymers.
We have also developed other modeling tools capable of predicting the curing time and viscosity buildup of coating systems in a broad range of seasonal temperatures. In this paper, we demonstrate some of the capabilities that can be used by formulators to select polyols based on first principles. Also discussed are the fundamentals behind the mechanistic models that predict prepolymer viscosity as a function of temperature, as well as curing profiles of coating systems at several temperatures as a function of time.
Introduction
In an effort to understand customer evolving needs in coating applications we conducted an extensive survey that provided valuable insights not only into the information customers value today but also on the tools they would like to have in the future to improve their experience in formulating polyurethane systems with Dow products.
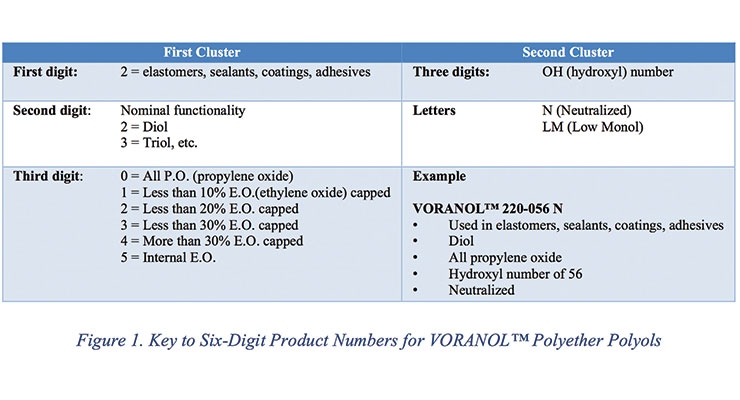
One piece of positive feedback from the industry was the six-digit product numbers for VORANOLTM polyols (Figure 1). This is considered by customers the most comprehensive system in the industry as it allows one to get at a glance the most relevant information about VORANOL polyols.
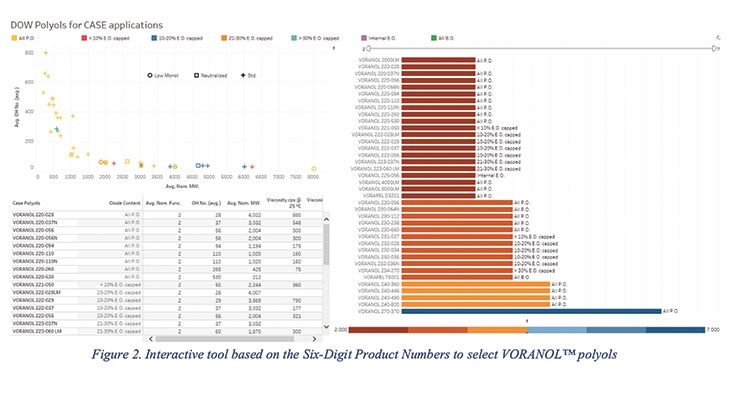
However, even the six-digit system can be overwhelming for a researcher looking for a specific polyol characteristic. Therefore, an interactive tool was developed to allow formulators to quickly find the polyol based on the criteria used by the six-digit product number as shown in Figure 2.
VORANOL polyols are often used to make prepolymers and, although Dow provides website information for prepared prepolymers, formulators of PU prepolymers expressed interest in having interactive tools to predict prepolymer viscosity and %NCO. Figure 3 shows the input variables for the model (highlighted in yellow) for five prepolymers based on VORANOL 220-056N and ISONATETM 125M Pure MDI.
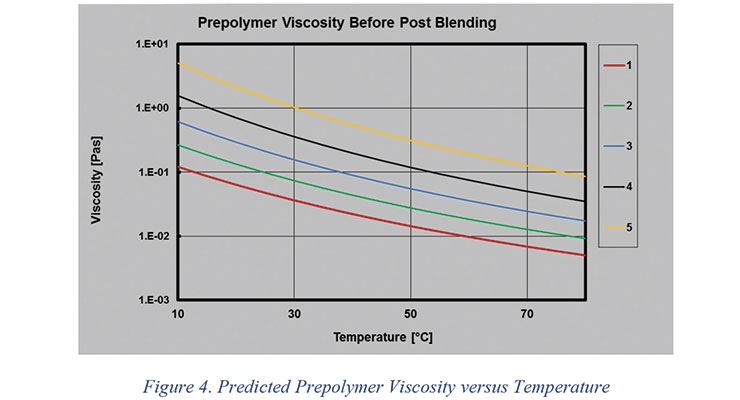
The model predicts prepolymer viscosity as a function of temperature based on fundamental features of the prepolymer composition. This allows the formulator to know the viscosity of the prepolymer in a broad range of temperatures as shown in Figure 4.
In addition to knowing the viscosity of the prepolymer itself as a function of ambient conditions, one of the significant challenges in formulating a two-component (2K) polyurethane (PU) liquid-applied thermoset coating system is to find the right balance between pot life and curing time for the intended application and environment. Coating applicators prefer products with long pot life and short curing times in a broad range of ambient conditions. If 2K polyurethane coatings are formulated to have a long pot life by foregoing the use of special amines or blocked hardeners, the curing time would be so long that moisture would react with the NCO groups generating undesirable bubbles in the coating.
By using kinetic modeling, the degree of cure can be predicted as a function of ambient temperature for a developmental 2K PU coatings system. The framework of the model, described in more details in the following sections, takes into account the effect of temperature on the kinetics of the chemical reactions as well as the effect of vitrification on these reactions. Lab scale experimental data were collected to estimate the kinetic parameters and to relate the degree of cure (extent of chemical reactions) to the coefficient of friction (CoF) of the curing 2K PU system measured with a Symyx Tack & Friction station.
Experimental
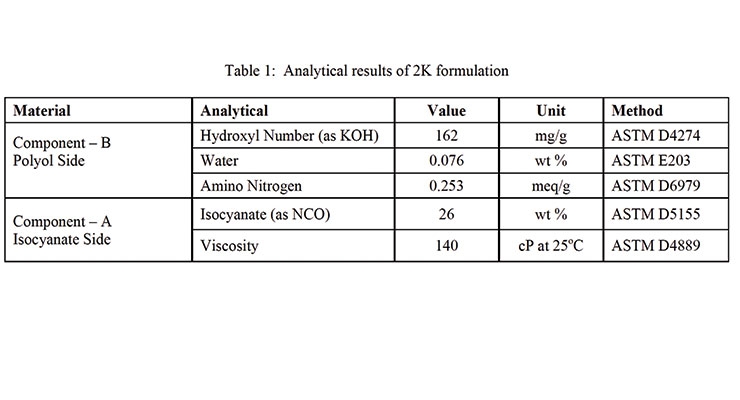
The predicted enthalpy of reaction of the 2K PU formulation in Table 1 was approximately 142 J/g assuming an average heat of reaction of 105 kJ/mole for the isocyanate-hydroxyl reaction.
Before use, the polyol blend was vigorously hand mixed until the material appeared visually homogeneous. Component-B was then pre-weighed into a FlackTeK cup and placed in a refrigerator (~4 °C) over the weekend before the isocyanate (Component-A) was added. The Component-A stock bottle was padded with nitrogen and also placed in the refrigerator (~4 °C) over a weekend before use. No crystallization of the material was observed.
The chilled Component-A was aspirated into a 5 mL syringe approximately 5 minutes before use. The cup containing Component-B was removed from the refrigerator and placed on dry ice. The Component-A syringe was tared on an analytical balance prior to adding its contents to a FlackTeK cup with cold Component-B (polyol). Components-A and B were immediately mixed using a DAC 150 FVZ FlackTeK speed mixer for 15 seconds at 3000 rpm.
An aliquot of the mixed Components was transferred to a tared Tzero aluminum hermetic pan and immediately sealed. In order to minimize reaction outside the DSC (differential scanning calorimeter, TA Q2000), the filled pan was not weighed but instead immediately placed in the DSC autosampler. Additionally, the DSC standby temperature was set to 20 °C prior to sample mixing. Note: the sample weight was taken after analysis and the DSC parameters updated accordingly.
DSC Conditions
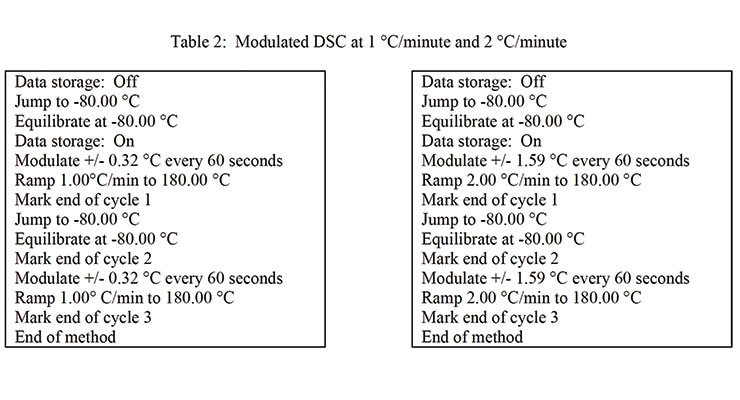
The DSC conditions that were used are indicated in Table 2.
Rheology Testing
Viscosity measurements with made using spindle #6 at 100 rpm in a Brookfield CAP 2000+L viscometer equipped with temperature control and high torque capabilities. Components A and B were mixed as described earlier. Approximately 10 g of the sample was then quickly added to the viscometer. The viscometer was preheated to 30 °C and then was heated at 1 °C/min.
Cure Profile
Mixtures of the developmental 2K systems were drawn down to approximately 10 mil thickness using a Symyx (currently Unchained Labs; also formerly Freeslate) Reactive Coating Station. The coating was then placed on a Symyx Tack & Friction Station where friction measurements were made at periodic intervals using a stainless steel sphere at a constant force of 30 g which relates to the cure profile of the coating by measuring the coefficient of friction (CoF) as a function of time on the curing coating.
Results and Discussion
Physical and Mechanical Properties
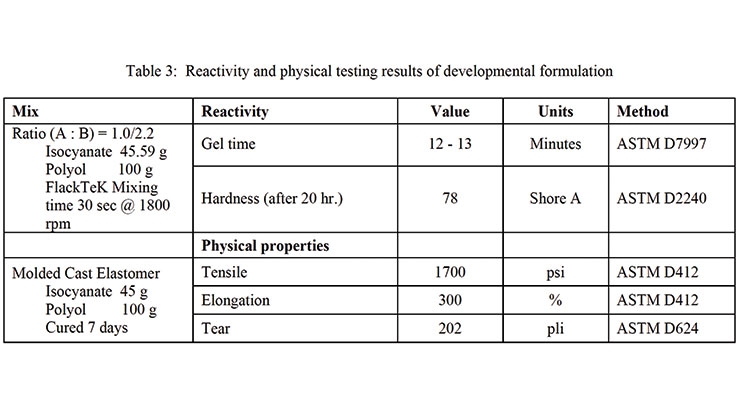
Table 3 shows the analytical and physical test results of the 2K PU system.
DSC Results
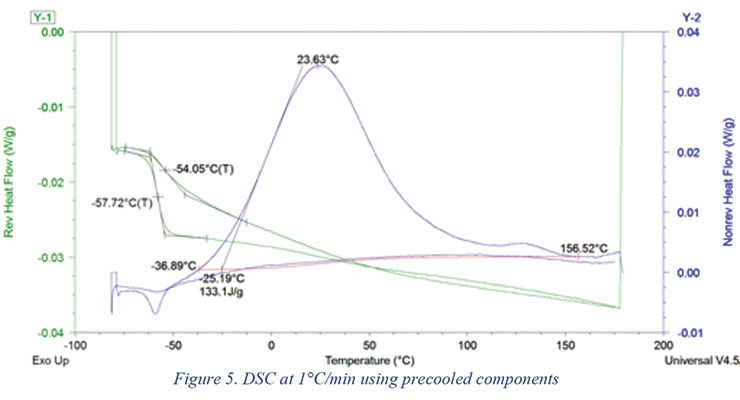
The results of the DSC analysis at 1 °C/min are shown in Figure 5. The time elapsed between the start of mixing until the DSC unit reached 0 °C was 244 seconds and until the DSC unit reached -80 °C it was 728 seconds. As shown in Figure 5, precooling the components prior to mixing and analysis resulted in capturing 94% of the predicted reaction enthalpy (133 J/g actual vs. 142 J/g theoretical).
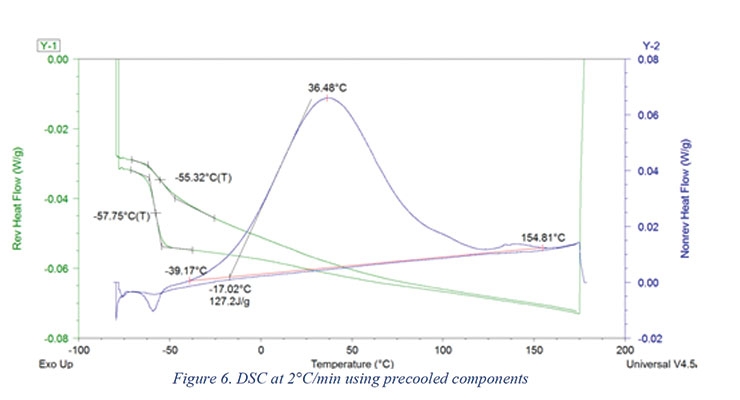
The results of the DSC analysis at 2 °C/min are shown in Figure 6. The time elapsed between the start of mixing until the DSC unit reached 0 °C was 220 seconds, and until the DSC unit reached -80 °C it was 877 seconds. As shown in Figure 6, precooling the components prior to mixing and analysis resulted in capturing 89% of the predicted reaction enthalpy (127 J/g actual vs 142 J/g theoretical).
Rheology Results
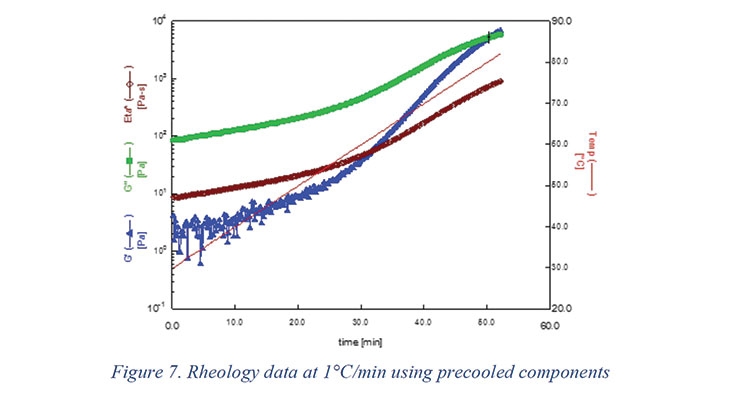
The rheology data collected at 1 °C/min is shown in Figure 7. The figure also shows storage (G′) and loss (G′′) as well. The two moduli cross over at about 50 min indicating the formation of chemical gel.
Cure Profile Measured via Coefficient of Friction as F(T)
The coefficient of friction (CoF) of the curing 2K PU system was measured with a Symyx Tack & Friction station. This measurement has been shown to relate to the cure profile of the material where the coefficient of friction is low (i.e., lubricating) while the materials are liquid but of high viscosity before gelation. For a hard coating, the CoF typically passes through a maximum during gelation as this is the highest resistance to lateral movement and then the CoF will decrease as the coating becomes hard and cured.
The CoF data generated from a 2K PU system (Figure 8) shows repeatable results, but lacks a maximum followed by a mild decrease in CoF upon full cure. In this case, due to the relatively soft nature of this elastomer, it does not follow the same CoF behavior of hard cross-linked wood or metal coating (i.e., CoF maximum followed by a plateau) because it is expected that such a soft material has a higher final CoF than a hard coating. Thus, the results are in line with expectations.
However, for softer elastomers, it appears it is not possible to fully decouple the gelation event and the fully cured state of the coating via CoF. Nonetheless, using the plateau of the CoF values, the cure time is in the range of 140-160 minutes. Of note, replicate 1 was not run long enough to see the full cure event but is consistent with replicates 3 & 4 which show data collection throughout the entire curing process.
Kinetic Modeling of Curing Reactions
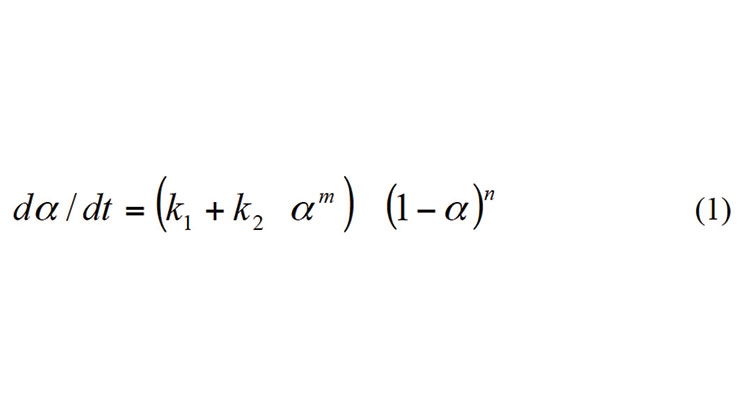
The framework of the kinetic model used in this report was originally developed to describe the kinetics and rheology of epoxy resin curing reactions.1 The model is based on the auto-catalytic kinetic model proposed by Kamal and Sourer.2
Here, α is the degree of cure which is calculated by assuming the curing rate is equal to the rate of heat released as a fraction of the total heat of reaction. The rate constant k1 depends upon the kinetics of the reaction without autocatalysis due to the product formed; while rate constant k2 depends upon the autocatalysis effects of the product formed during the reactions. As a result, the above equation can describe the kinetics of curing reactions in a wide range of formulation that may or may not involve autocatalysis.
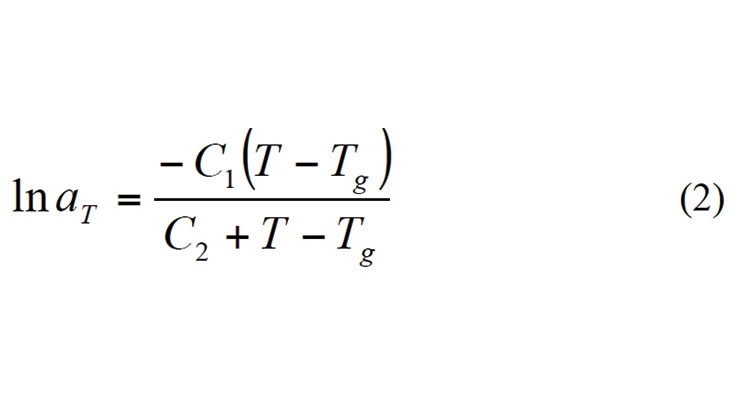
In the original Kamal and Sourer model, these rate constants were assumed to be Arrhenius form. However, in systems where the glass transition temperature exceeds the curing temperature, the curing reaction may be limited by the mobility of the molecular segments and the reaction rate may become negligible even when significant amounts of uncreated groups are present and the curing temperature is high enough for the curing reactions to take place. Gillham et. al.
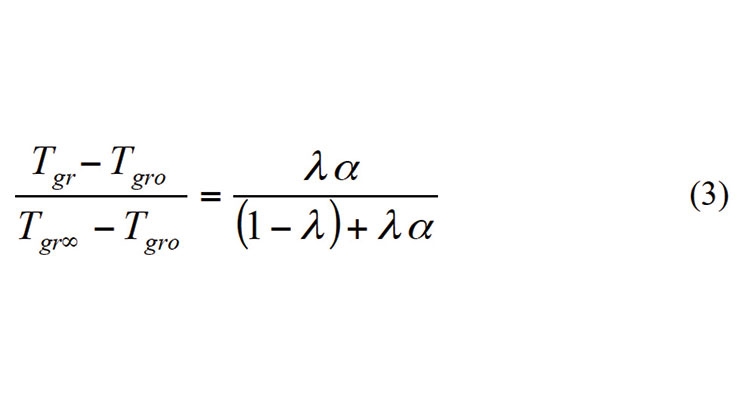
Here aT is the relaxation time, Tg is the glass transition temperature. C1 and C2 are constants and their values were proposed to be 40.2 and 51.6 oC by Williams et. al. However, in actual practice, values of these constants may differ from polymer to polymer. The glass transition temperature is usually described by the DiBenedetto equation (3) and the glass transition temperature can be related to the degree of cure.4
Here Tgro and Tgr∞ are the glass transition temperatures at zero cure and full cure. In the original equation, λ was proposed to be the ratio of change in specific heat at the glass transition temperature of the cured material to that of the uncured material. However, as the change in specific heat decreases with the glass transition temperature, λ can be assumed to be the ratio of the glass transition temperatures of the uncured to cured material.
Elastomeric polyurethanes are known to have two distinct glass transition temperatures after curing due to phase separation of the hard segments. The lower Tg value corresponds to the glass transition of the soft segments while the higher value corresponds to that of the hard segments. Since curing reactions take place in the soft phase, it is this value of Tg that has to be used in equation (3). The heat flow data of the 2K PU system, shown in Figures 5 and 6 do not show a clear glass transition for the soft segments after curing. Since instantaneous cooling was used after the first dynamic scan, the soft and hard segments did not have enough time to separate into distinct phases. Dynamic Mechanical Thermal Analysis was used to obtain the Tg of the soft phase.
During the reactions of the prepolymers with the chain extenders, the glass transition temperature of the soft phase will first increase as the amount of hard segments increases. Under isothermal reaction conditions, the glass transition temperature will stop increasing after phase separation has started. The value of λ in equation (3) must be chosen to reflect this behavior.
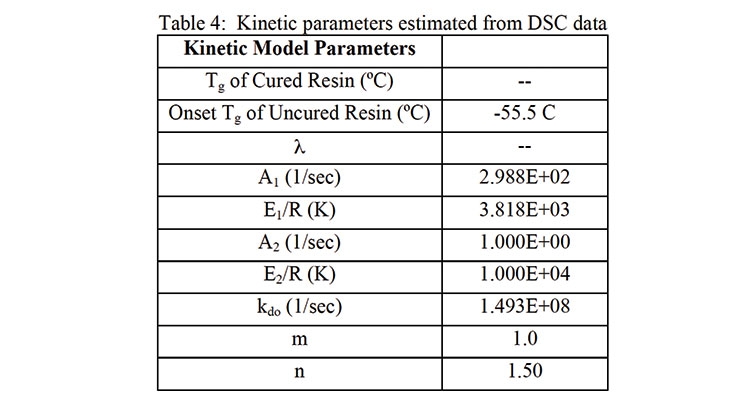
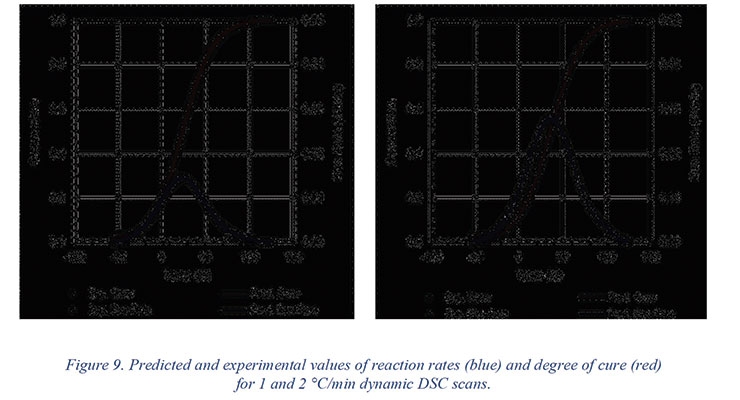
Microsoft Excel Solver was used to estimate the DSC kinetic model parameters. The DSC method used in this study involved instantaneous quenching (cooling) of the sample as soon as it was placed in the DSC. It was then heated at 1 or 2 °C/min with modulation (Table 4). Assuming a heat of reaction of 105 kJ/mole of reaction, the theoretical heat of reaction of the formulation shown in Table 1 is 142 J/g. As shown in Figure 5 and Figure 6, the heat of reaction released during the DSC scan was 133.1 and 127.2 J/g using 1 and 2 °C/min temperature scans (respectively). For estimation purposes, it was assumed that 3% of the reaction took place during preparation and mixing time.
As discussed earlier, our experimental technique could not capture the glass transition temperatures of hard and soft segments after curing. However, for all practical purposes, the glass transition temperature of the soft segments stays below the temperature during dynamic temperature scans and that diffusion of molecular segments is much faster than curing kinetics.
The parameter values in Table 4 show that autocatalysis of the reactions, due to the presence of urethane groups, did not affect the curing kinetics. The optimization of the kinetic parameters was repeated with different initial values. The autocatalytic rate constant kk2, given by equation (5) was negligible each time.
Figure 9 shows the predicted (lines) and experimental values (markers) of the reaction rates and degree of cure for 1 and 2 °C/min dynamic DSC scans. The reaction rates are shown in blue while the degree of cure is shown in red.
Rheology Modeling
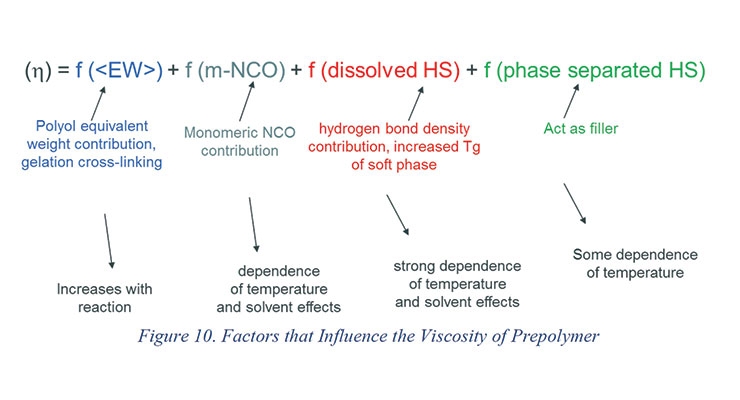
Figure 10 shows a schematic of various factors that influence the viscosity of the prepolymer before and during the reaction with the chain extenders and the dependence of viscosity on temperature. The viscosity of the prepolymer depends upon type, functionality, and equivalent weight of polyols and isocyanates used in making the prepolymer as well as their ratios. A prepolymer with high NCO percent will have a significant amount of monomeric isocyanate which acts as solvents for the prepolymer chains. The urethane linkages that are formed while making prepolymers have a strong tendency to hydrogen bond and thus influence the prepolymer viscosity. A large number of urethane linkages will also increase the dependence of viscosity on temperature.
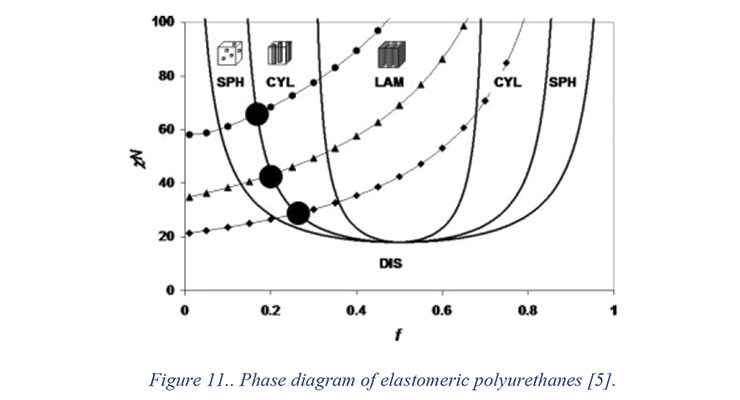
While prepolymers do not have phase separated hard segments (urethane linkages), phase separation will take place when the prepolymer reacts with the chain extender. The extent of phase separation depends upon a number of factors including the cohesive energies of hard and soft segments and the temperature. As the curing reactions proceed, the urethane linkages formed increase the glass transition temperature of the material. At a certain point, the concentration of hard segments increases above the solubility limit and hard segments start phase separating. The solubility limit itself depends upon the temperature. Figure 11 shows an isothermal phase equilibrium diagram of a typical elastomeric polyurethane system.5 In the diagram, the incompatibility factor, described by the product Flory-Huggins parameter (χ) and hard segment chain length (N) against the hard segment fraction. In general, as the fraction of hard segment increases in the final coating, the hard segment chain length increases as well. Thus in a typical elastomeric system, as the prepolymer isocyanate content is increased, the material follows a path along the dashed line.
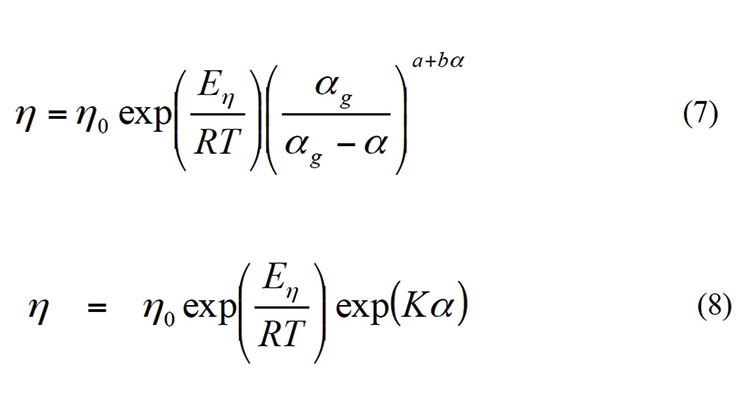
Historically, the viscosity of thermoset materials during curing as a function of the degree of cure and the temperature is described by Castro and Macosko and Seferis Models.6,7
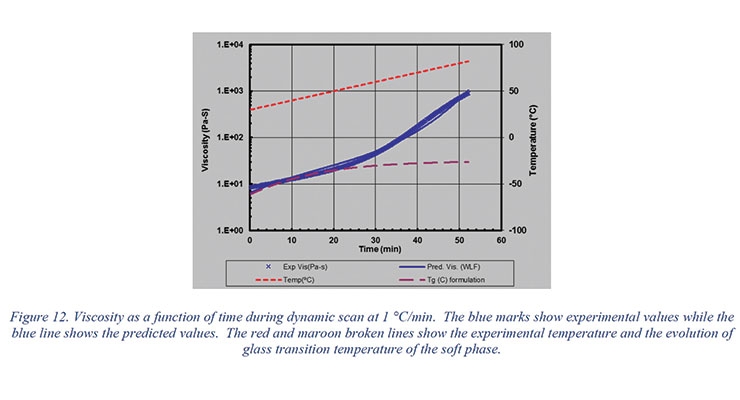
In the above equations, αg is the degree of cure when the material gels and a, b and K are constants estimated from the experimental data. The Williams-Landel-Ferry (WLF) equation has also been used to describe the variation of viscosity with temperature.4 In our experience, a combination of the WLF equation and the Castro-Macosko models worked best to describe the viscosity evolution during the curing reactions. Figure 12 shows viscosity as a function of time during a dynamic scan at 1 °C/min. The blue marks show experimental values while the blue line shows the predicted values. The red and maroon broken lines show the experimental temperature and the evolution of the glass transition temperature of the soft phase.
Application of Kinetic Models
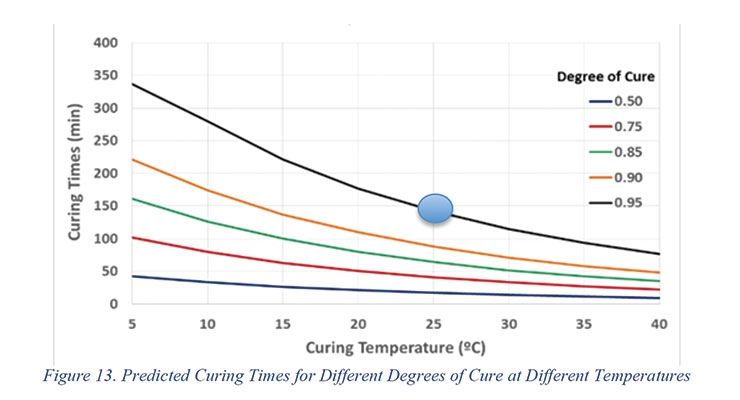
The kinetic model was used to predict the time it will take to achieve 0.50, 0.75, 0.85, 0.90, and 0.95 cure at various application temperatures (Figure 13). This will allow
the coating applicator to better plan their activities during processing.
The predicted times to achieve different degrees of cure as a function of ambient temperature will permit the end user to estimate the curing time of the reaction mixtures. Kinetic data will also be correlated to the coefficient of friction data shown in Figure 8.
While the gel time of 2K PU system is 12 - 13 minutes at room temperature, the CoF data suggests that the cure time is in the range of 140-160 min, which corresponds to a degree of cure of ≥ 0.95 at 25 °C. The gel time measured according to ASTM D7997 was an indication of the pot life of the 2K PU system under adiabatic conditions, while the CoF, measures drying and curing that occur in films at the isothermal conditions found in coatings applications.
Conclusions
To improve our customer’s experience we have developed searching and modeling tools that would allow formulators not only to quickly find the components they need but also to predict the viscosity of basic prepolymers.
We have also developed other modeling tools capable of predicting the curing time and viscosity buildup of 2K PU coating systems in a broad range of seasonal temperatures.
Using kinetic modeling, the degree of cure as a function of ambient temperature can be predicted for 2K PU coating system. Although it appears it is not possible to decouple the pot life as measured by ASTM D7997 and the fully cured state of the coating using CoF for soft elastomeric coatings, the CoF data suggests that the cure time is in the range of 140-160 min, which corresponds to a computed degree of cure of ≥ 0.95 at 25°C.
This result validates the ability of the kinetic model to predict the degree of cure as a function or temperature and that the use of the CoF method to evaluate the degree of cure as a function of time.
References
1. Shafi, M.A., Aguirre, F, et al., Rheokinetic modeling of Fusion Bonded Epoxy powder coatings at standard and low application temperature., International Conference on Pipeline Protection, 18, 81-91, (2009).
2. Sourour, S.; Kamal, M. R.; “Kinetics and thermal characterization of thermoset cure,” Thmnochirnica Ada, 14 , p 41-59, (1976).
3. Aronhime, M. T. and Gillham, J. K., “Time-Temperature-Transformation (TTT) Cure Diagram of Thermosetting Polymeric Systems,” in Epoxy Resins and Composites III, K. Dusek, Ed., Springer-Verlag, (1986).
4. Van Krevelen, D. W., “Properties of Polymers,” Pages 61-108, Elsevier Scientific Publishing Company, (1976).
5. Ginsburg, V., Bicerano, J., Christenson, C. P., and Schrock, A. K., “Theoretical Modeling of the Relationship between Young’s Modulus and Formulation Variables for Segmented Polyurethanes,” Journal of PolymerScience: Part B: Polymer Physics, Vol. 45, 2123–2135 (2007)
6. J.M. Castro and C. Macosko, A.I.Ch.E. J., 28, pg. 251, (1982).
7. M. R. Dusi, C. A. May, and J. C. Seferis, ACS Symp. Series, 227, 301 1983).

